Call Today: (704) 931-8801

Each month, I produce a report for each of my clients. These reports provide an excellent opportunity to identify what’s working and what’s not. In other words, we know what we should do more of or work harder on (or even stop trying).
If we’re working hard and consistently on our SEO campaign, the graph typically rises to the right, increasing each month. That’s the point. Not really. The fact is that the traffic produces more customers, of course. For this article, however, I’m focusing on traffic. Just know that traffic is a means to an end and not the end in itself.
I said that traffic “usually” goes up. Sometimes it does not. Sometimes it goes down month-to-month. Why?
Seasonality is real. Every business ebbs and flows throughout the year. Every industry has busy times and slow times. We need to consider this when providing SEO reports, as customers’ demand can significantly influence organic search traffic. If customers aren’t searching for your products or services, your organic search traffic will decrease.
The problem is: how do we know traffic is down due to seasonality? It’s easy to suggest this, but how can we be so sure? Are we just making excuses or jumping to conclusions?
Let me introduce you (if you’ve never met) to Google Trends. Google provides information about how many people searched for a particular phrase, topic, or even company each month. The data goes back several years. Google Trends is a great way to understand if seasonality is affecting your organic search traffic objectively.
I’ve started using Google Trends data in my monthly client reports, comparing the client’s organic search traffic with customer demand as indicated by Google Trends data. Here’s an example:
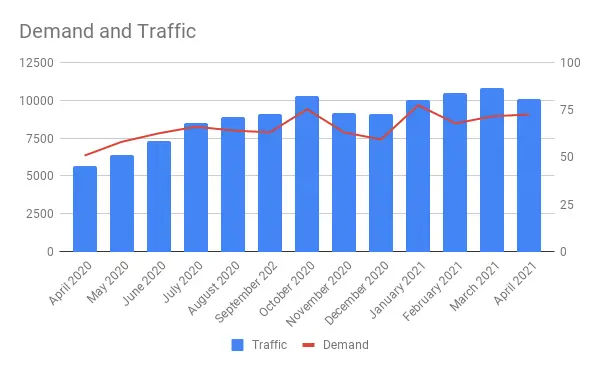
This idea came to mind in April 2020, with the onset of the pandemic. Was my client’s traffic down due to my poor SEO tactics or because of customer demand? Google Trends helped me show (objectively) that it was due to customer demand.
UPDATE: Trends data can also help in a world of LLMs, which are stingy when it comes to sharing traffic with your website. Since traffic from LLMs is one of the few ways we have to measure our success in LLMs, if our traffic is down, is it because they no longer respect our site or because of seasonal demand? Google Trends can help clarify.
Before comparing data, you need to identify the Google Trends entity against which you would like to compare your traffic. To do this, start from your keyword research. What is the broadest and most relevant phrase that describes what your business offers? Try entering these into Google Trends and see what you find.
For example, I might start by searching for “SEO.” That’s what I do, but that phrase is too broad: it could mean “what is SEO?” or it could be “how do I do SEO?” That’s not a phrase my customers are searching for to find my services.
If I pay attention to the automatic suggestions, related topics, and related queries, I can find a phrase that most resembles the services I provide: SEO Professional. That’s me!
I’m also looking for a “topic” and not just a “search query.” What’s the difference? A topic is the idea around “SEO professional” and is not limited to people searching for the specific query. I’m not interested in the interest in a particular phrase. I’m interested in the broader topic of “SEO professional,” which encompasses related terms. When doing this for yourself, look for a “Topic” that describes the core services your company provides.
You can confirm that you’ve chosen the right topic by reviewing the related queries in the report. Are these phrases your customers might use to find you? Don’t forget: you can modify the related topics to not just “rising” interest but “top” interest. “Rising” interests are topics or queries that are recently popular. For this purpose, we’re probably more interested in “top” data, as we want to know about ideas that are common and not new.
Yes, most companies provide more than one service or product. For this purpose, we’re examining overall organic search traffic and a primary topic related to your company. You could break this down by examining traffic to a specific landing page compared to other, more specific issues, but that’s too granular for this article.
In some cases, you should limit your Google Trends search by geographical modifiers. You can only provide your services in a state or a metropolitan area. You can zoom in on your topic by geographical regions to get even more specific data.
Once you’ve zeroed in on the most relevant topic that describes your business, you can download your “Interest over time” data and compare it against your organic search traffic. With a bit of Excel magic (the averageifs function is beneficial to combine data into months), you can compare the data in one chart.
“Organic traffic” can be a somewhat ambiguous term. Google Analytics (from which I get my data to compare) doesn’t even use the word “traffic.” What am I comparing? I compare sessions from organic search, reflecting visits to my website. I could compare “users” (or visitors) from organic search in this graph, but that wouldn’t weed out people who have already been introduced to me and are returning to my website, which wouldn’t necessarily be affected by customer demand or Google Trends data. Alternatively, I could compare “New Users” from my website to those from organic search as well. The most important point: make sure you’re clear on what you’re comparing, so you don’t compare apples and oranges.
A couple of caveats to the data: Google Trends shows you a number between 0 and 100 representing an interest in your topic. This number is not the same as the number of visitors. The number isn’t even the same as the number of searches a month (like you might find in Google Ads Keyword Planner). It is simply a scale showing interest. You’ll have to compare data using a different scale from your organic traffic.

What does this data mean?
Another thing that can significantly affect organic search traffic is branded searches. After Google removed keyword search query data from Google Analytics, it became hard to determine how much of our SEO traffic resulted from our SEO efforts or the result of interest in our brand. Suppose you have a company with a well-known brand. In that case, your organic search traffic reports reflect brand awareness rather than actual SEO value, introducing people to your company’s services who have never heard of your brand or didn’t know your brand offered that service.

You can also use Google Trends data to track interest in your brand. Follow the same process we used to identify the topic that best describes our business, but for your company’s name. Again, we’re not looking for a “search query” here, so much as a “topic” – or, better yet, Google will identify your brand as part of a topic if you have a very significant brand. We refer to this as an “entity.”
Your brand might not be large enough to be considered a distinct entity. If that’s the case (and you can’t find your brand name outside of a mere search query in Google Trends), you won’t be able to compare your data with demand for your brand. However, if you can find yourself as a brand, this can be an additional and valuable insight into the success of your SEO (or LLM) campaign.
As you can see from these graphs (each based on actual client data), I’ve started including this in my monthly reports. I hope that this prevents me from letting seasonality become an excuse and instead challenges me to be an even better SEO. I hope this has the same effect on you.
David Zimmerman has earned his Google Analytics Certification.
Learn why we're reliable.
Read our other credentials.
Reliable Acorn will help you create a custom digital marketing strategy that does just that.
Ready to Talk?